

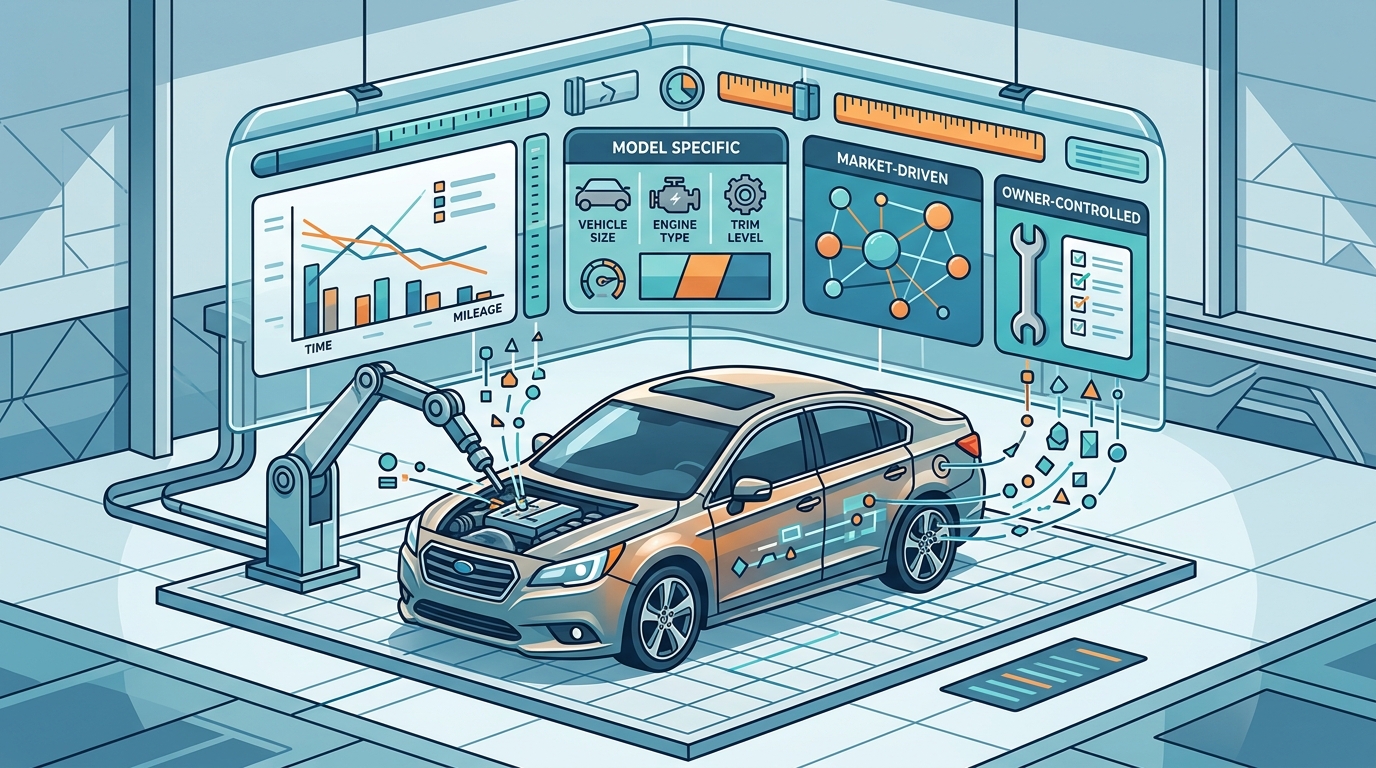
Your car starts losing value the moment you register it. But how fast it depreciates depends on a surprisingly wide range of model-specific, owner-controlled, and market-driven variables. This ultimate guide breaks down every major factor so you can forecast—and minimize—the value loss on your particular vehicle.
Baseline Depreciation: What the Averages Actually Say
Before examining model-specific nuances, it helps to understand the industry average. According to Kelley Blue Book, new cars depreciate roughly 30 percent over the first two years and then continue to lose 8–12 percent each year after that. By the five-year mark, a typical vehicle has shed around 60 percent of its original purchase price.
However, averages mask enormous variation. iSeeCars data from 2026 shows the difference in five-year depreciation between the best and worst models can be as wide as 40 percentage points. A Toyota Tacoma might retain nearly two-thirds of its value while a Nissan LEAF loses over 63 percent. Your specific model’s position on that spectrum is what matters most.
Make, Model & Segment: The Single Biggest Variable
Brand Reputation & Reliability Perception
Brands with strong reliability reputations consistently outperform. Kelley Blue Book projects that Toyota and Lexus have the lowest five-year cost to own among all brands, largely because of their slower depreciation curves. Conversely, luxury and performance marques with less stellar reliability reputations tend to depreciate much faster.
Vehicle Segment
Segment choice alone can dramatically change your depreciation trajectory. Trucks are the number-one vehicle segment for retained value according to iSeeCars 2026 data, with names like the Toyota Tacoma, Toyota Tundra, Ford Ranger, Jeep Gladiator, and GMC Canyon all outperforming the truck segment’s already-impressive 34.2 percent average five-year depreciation rate. Small pickups have historically held their value roughly twice as well as luxury sedans.
On the other end, luxury vehicles and electric vehicles dominate the highest-depreciation lists. In the 2026 iSeeCars study, luxury and EV models accounted for 24 of the 25 cars that lose the most value over five years.
Model Popularity & Demand
High demand on the used market slows depreciation. When buyers are actively searching for a particular model—think Toyota 4Runner or Honda Civic—resale prices stay elevated. Models with niche appeal or oversupply from fleet sales tend to lose value faster.
Mileage & Usage Patterns
High mileage is the most straightforward accelerant of depreciation. A car driven 30,000 miles per year will be worth substantially less than an identical vehicle driven only 5,000 miles annually. The industry considers 12,000–15,000 miles per year as average; consistently staying under that threshold can slow depreciation by roughly 5 percent compared to the standard curve.
Usage type matters too. Highway miles are generally gentler on a vehicle than stop-and-go city driving, and cars that have been used as rideshare or rental fleet vehicles carry a stigma that compresses their resale price regardless of mechanical condition.
Condition, Maintenance Records & Accident History
Physical Condition
Exterior and interior damage—dents, scratches, stained upholstery, cracked dashboards—directly reduce what buyers are willing to pay. Professional detailing before sale can recover some value, but prevention is far cheaper than remediation.
Service Records
Complete maintenance records can increase resale value by up to 15 percent according to automotive tracking platforms. Buyers treat documented oil changes, tire rotations, and scheduled services as proof that the vehicle has been cared for, which reduces their perceived risk.
Accident History
Even after perfect repairs, a vehicle history report showing an accident causes a permanent reduction in market value. This phenomenon is known as diminished value, and it applies whether the accident was minor or major. A clean Carfax or AutoCheck report is one of the strongest value anchors your vehicle can have.
Electric Vehicle-Specific Factors
EVs as a category still depreciate faster than internal combustion vehicles over the first three to five years, but the gap between the best and worst EV models is massive—ranging from roughly 45–50 percent loss to 65–75 percent or more over five years.
Battery State of Health (SOH)
Battery SOH measures how much usable capacity remains compared to when the battery was new. A healthy battery slows depreciation while a degraded one accelerates it. For used EVs, a verified battery health report is becoming as essential as a mechanical inspection is for a gas car.
New-Vehicle Price Cuts & Incentives
When manufacturers like Tesla slash new-vehicle prices, used values of those same models instantly drop. Similarly, a $7,500 federal tax credit on new EVs compresses what buyers are willing to pay for a comparable used unit. These policy and pricing shifts make EV depreciation less predictable than traditional vehicles.
Technology Obsolescence
Older EVs with shorter range, slower charging speeds, or weaker software age faster than equivalent gas cars. Rapid improvements in battery technology and autonomous features mean a three-year-old EV can feel dated in ways a three-year-old Camry does not.
Market Forces & Economic Conditions
Supply & Demand Dynamics
The pandemic-era chip shortage dramatically illustrated how supply constraints affect depreciation. In 2021, used cars actually appreciated by over 28 percent—an unprecedented event—because new-vehicle production was severely limited. As inventory normalized through 2025 and into 2026, depreciation patterns have gradually returned to historical norms.
Interest Rates
Higher interest rates make car loans more expensive, which can suppress demand for both new and used vehicles and accelerate depreciation. When financing costs drop, used vehicle demand typically rises, supporting stronger resale values.
Fuel Prices
Fuel price swings can shift demand between segments almost overnight. High gas prices push buyers toward fuel-efficient cars and hybrids, improving their resale values while hurting large trucks and SUVs. The reverse happens when fuel is cheap.
2026 Market Snapshot
The latest iSeeCars analysis of over 950,000 five-year-old used cars sold between March 2025 and February 2026 found that average five-year depreciation improved to 41.8 percent—a 3.8 percentage-point gain over 2025. Every major vehicle segment is retaining more value than the prior year, suggesting rising used-car demand and tightening supply.
Owner-Controlled Levers to Slow Depreciation
- Keep mileage below average. If you have a long commute, consider a dedicated commuter vehicle to preserve the primary car’s value.
- Maintain religiously and keep records. Documented service history is a tangible value booster.
- Avoid unnecessary modifications. Custom paint, aftermarket wheels, and performance tunes appeal to a narrow buyer pool and can actually reduce resale value.
- Protect the exterior. Garage parking, paint protection film, and prompt repair of minor damage pay dividends at resale time.
- Choose popular colors. White, black, gray, and silver consistently command stronger resale prices than unusual hues.
- Sell privately rather than trading in. You’ll typically capture more of the vehicle’s market value through a private sale.
- Time your sale. Sell before major depreciation milestones—common wisdom suggests before 60,000 miles or before the factory warranty expires.
Tools to Track Your Model’s Depreciation Curve
| Tool | What It Offers | Best For |
|---|---|---|
| Kelley Blue Book Depreciation Calculator | Value forecasts by year, make, and model with trade-in and private-party pricing | Quick resale estimates |
| CarEdge Depreciation Calculator | Historical curves for 300+ models going back up to 12 years | Comparing models before purchase |
| iSeeCars Depreciation Studies | Annual research ranking models from best to worst retained value | Identifying segment trends |
| Carvetka | Combines maintenance history, condition, and market data for personalized projections | Ongoing ownership tracking |
Key Takeaways
- Model choice is the dominant factor. The gap between the slowest- and fastest-depreciating models can exceed 40 percentage points over five years.
- Trucks and mainstream brands hold value best. Toyota, Honda, and select truck nameplates consistently top resale charts.
- Luxury and EV models depreciate fastest. Rapid tech cycles, incentive shifts, and premium pricing compress used values.
- Mileage, condition, and service records are the factors you control. Low mileage and complete documentation can materially slow your car’s depreciation.
- Market conditions create short-term swings. Interest rates, fuel prices, and supply constraints can temporarily override model-level trends.
- Use data tools to forecast your specific model. Generic averages hide wide variation; model-level depreciation calculators give you a far more accurate picture.
Frequently Asked Questions
How much does a new car depreciate in the first year?
Most new cars lose about 20 percent of their value in the first year of ownership. Some models lose as little as 10–12 percent, while others—especially luxury and EV models—can lose 25 percent or more.
Which car brands depreciate the slowest?
Toyota and Lexus consistently rank as the brands with the strongest value retention. Honda, Subaru, and Porsche (in the sports-car segment) also perform well. Toyota holds 10 of the top 25 spots in the 2026 iSeeCars retained-value study.
Do electric vehicles depreciate faster than gas cars?
On average, yes. EVs as a group lose more value over three to five years than comparable internal combustion vehicles. However, the spread between the best and worst EV models is enormous, so choosing the right model is critical.
Can I slow my car’s depreciation?
You cannot stop depreciation, but you can slow it by keeping mileage low, maintaining a complete service history, avoiding accidents, skipping excessive modifications, and selling before major mileage milestones.
How does mileage affect depreciation?
Higher-than-average mileage accelerates value loss. Keeping annual mileage under the 12,000–15,000-mile average can reduce your depreciation rate by roughly 5 percent relative to the standard curve.
Why did used car values go up during the pandemic?
A global semiconductor shortage constrained new-vehicle production, which pushed buyers to the used market and drove prices up. In 2021, the average used car appreciated by over 28 percent. Values have since moderated as new-car inventory recovered.
What is the average 5-year depreciation rate in 2026?
According to iSeeCars data covering over 950,000 transactions, the average five-year depreciation rate in 2026 is 41.8 percent, an improvement of 3.8 percentage points compared to 2025.